
CAPATA Financial’s take on today’s FOMC press conference and announcement:
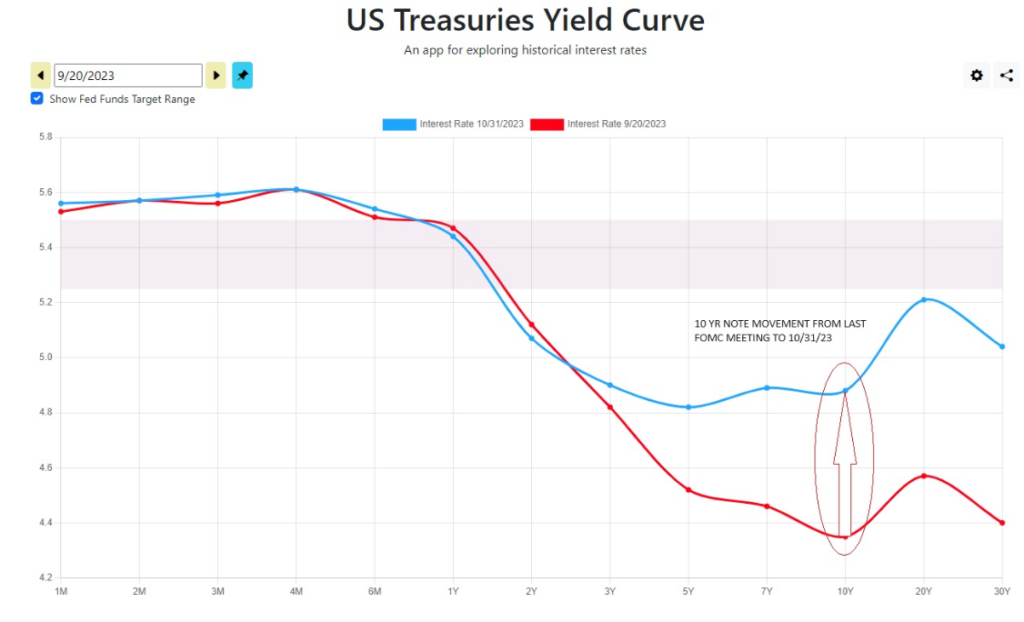
- The Treasury yield curve graphed below shows the yield curve from 09/20/23, the date of the last FOMC meeting, to 10/31/23:1
- Highlighted is the movement in the 10-year during that time frame between meetings, from 4.35% to 4.88%. To put the magnitude of this move in the 10-year into historical context, we can look back to the “taper tantrum” episode in 2013. On May 22, 2013, Federal Reserve Chair Ben Bernanke announced that the Fed would start tapering asset purchases at some future date. As a result, the yield on 10-year U.S. Treasuries rose from around 2% in May to around 3% in December. This sharp climb in yields is often referred to as the “taper tantrum.”
- Chairman Powell referenced this period during an AEA interview in January 2019, saying that everyone at the Fed had scars from the taper tantrum episode.
- The Fed is aware that long-term rates, especially the 10-year note, impact financial conditions more so than the overnight Federal Funds rate. The 10-year Treasury has implications for broader credit conditions, affecting interest-rate-sensitive parts of the economy including mortgage rates, car loans, and credit card receivables, etc.
- The 50 basis points (bps) move on the 10-year between meetings is much more significant to the tightening of financial conditions than a 50bps move in the Fed Funds rate.
- The stance of monetary policy is restrictive, and the full effects of our policy tightening have not been fully felt in the economy:
- Powell made this comment during the press conference, and it serves as a historical reference to Milton Friedman’s concept of ‘long and variable lags,’ which has been cited by economists and Fed Chairs since Friedman articulated it in the 1950s. No one knows precisely when the transmission of monetary policy will impact the real economy. If you asked 100 Ph.D. economists, you would likely receive 100 different answers. As Yogi Berra said, “Making predictions is tough, especially about the future.”
- The first question Chairman Powell wants to answer is, “Have we achieved a stance of monetary policy that is sufficiently restrictive to bring inflation down to 2% sustainably?”
- The second question he wants to address is, “How long will we need to keep policy restrictive?”
- Supply and demand in the workforce have come into balance:
- Powell has suggested that ‘this time may be different,’ meaning that historically during Fed tightening cycles, unemployment has fallen much further and faster than what we have observed during this cycle. When the Fed began its tightening in March ’22, there was a ratio of 2 job openings for every 1 person seeking employment. We are still at 3.8% unemployment, and we see the tight labor market impacting union negotiations and their ability to secure historically high wage increases. The Fed aims to avoid a ‘price/wage spiral,’ a term we haven’t heard since the 1970s/1980s.
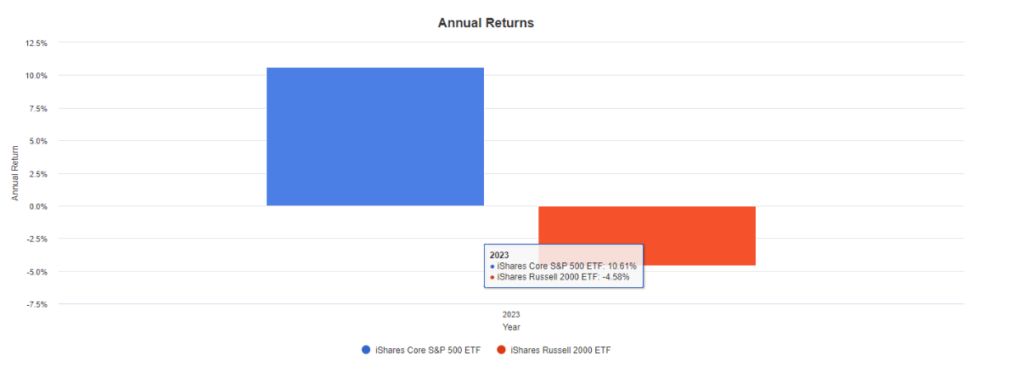
- The impact of higher long-term rates and the cost of capital is evident in the discrepancy between US large-cap stocks represented by IVV (S&P 500) and small-cap domestic stocks represented by IWM (Russell 2000 Index), charted below: “Higher long-term rates are to stocks what gravity is to the apple,” as Warren Buffett once observed.
1. The stronger balance sheets of larger companies have shown more resilience to the tightening cycle.
2. Typically, small-cap stocks are affected by higher costs of capital and an anticipated slowing of the economy.2
In summary, we anticipate that if long-term yields, specifically the 10-year note, continue to rise, the committee will maintain the Fed Funds rate at current levels moving forward, and the flattening of the yield curve will increase the probability of a recession. It may seem counterintuitive to hope for an inversion in the yield curve, but that may be the Fed’s best option for orchestrating a soft landing.
1 Source: https://www.ustreasuryyieldcurve.com/ Yield curve graphed on 09/20/23 and 10/31/2023.
2 Source: https://www.portfoliovisualizer.com/backtest-portfolio#analysisResults Graph produced with 2023 annual returns as of 11/01/23 for IVV and IWM.
Source: Federal Open Market Committee (FOMC), Press Conference, Nov. 1, 2023.
The content is developed from sources believed to be providing accurate information. The information in this material is not intended as tax or legal advice. It may not be used for the purpose of avoiding any federal tax penalties. Please consult legal or tax professionals for specific information regarding your individual situation. This material was developed and produced to provide information on a topic that may be of interest. The opinions expressed and material provided are for general information and should not be considered a solicitation for the purchase or sale of any security.
CAPATA Financial LLC offers wealth management services through various unaffiliated companies including advisory services offered by Diversify Advisory Services (“Diversify”) an SEC registered investment adviser. CAPATA Financial LLC offers additional investment services and securities through DFPG Investments, LLC., a broker/dealer, member FINRA / SIPC, and an affiliate of Diversify.
